Gallery
SignalPlot ships a small cookbook of example scripts under examples.
This gallery shows the figures those scripts produce so users can see the
intended outcomes before copying patterns into their own projects.
Each image corresponds to a runnable script in examples/.
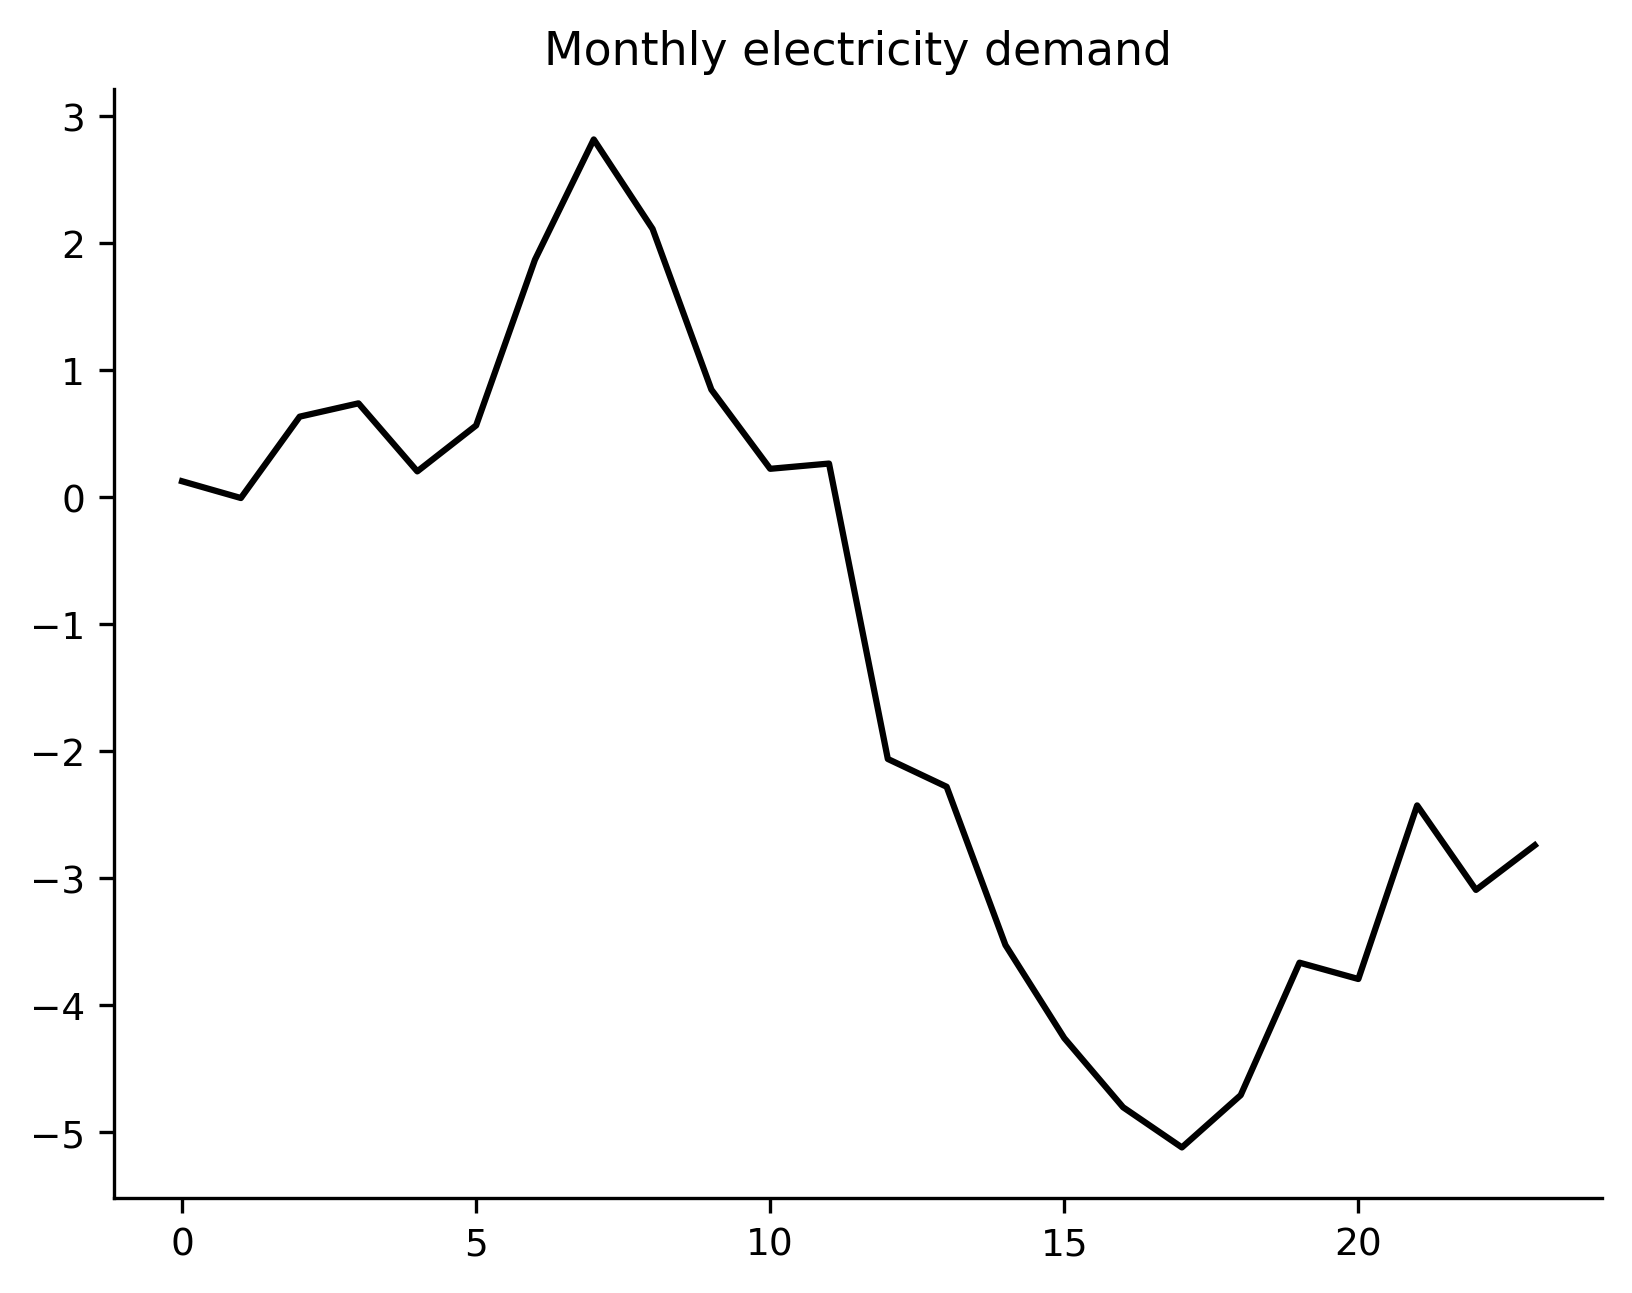
Time series line
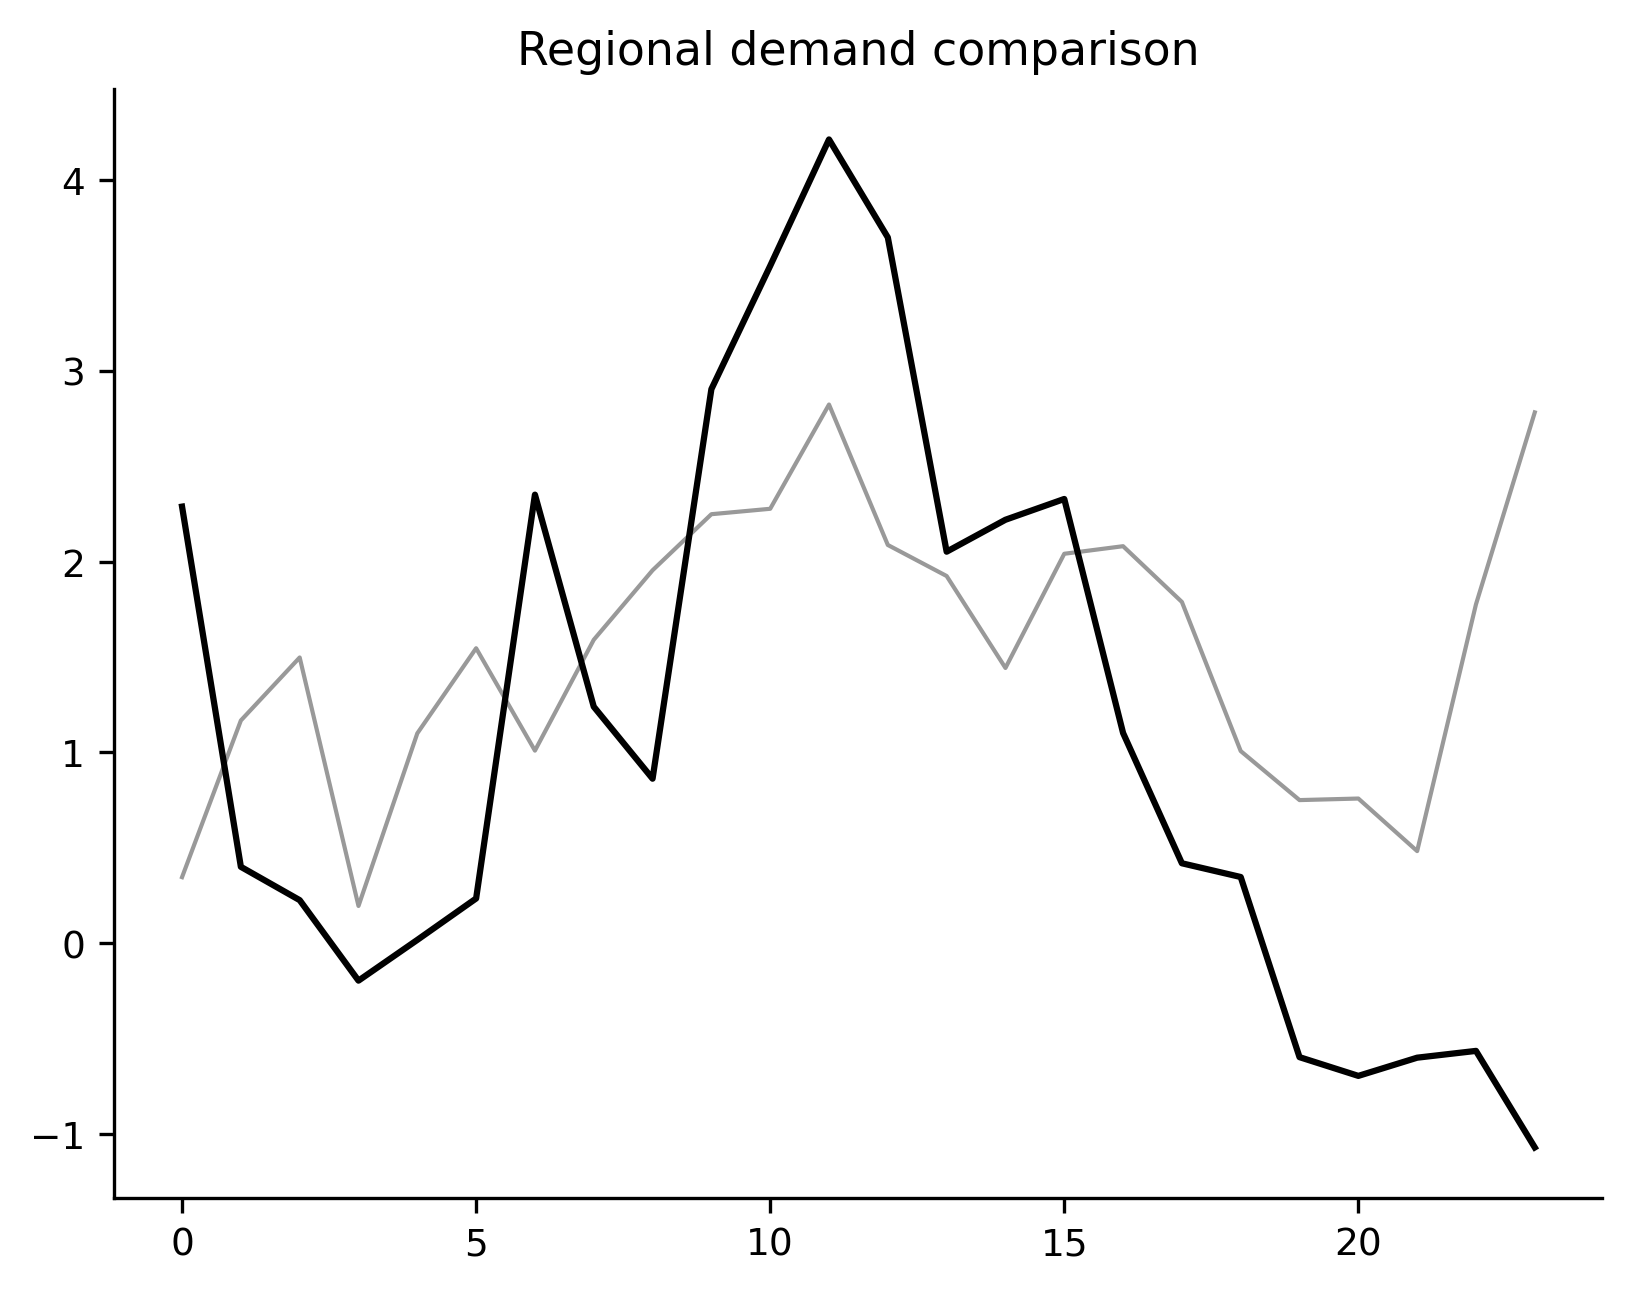
Multiple line comparison
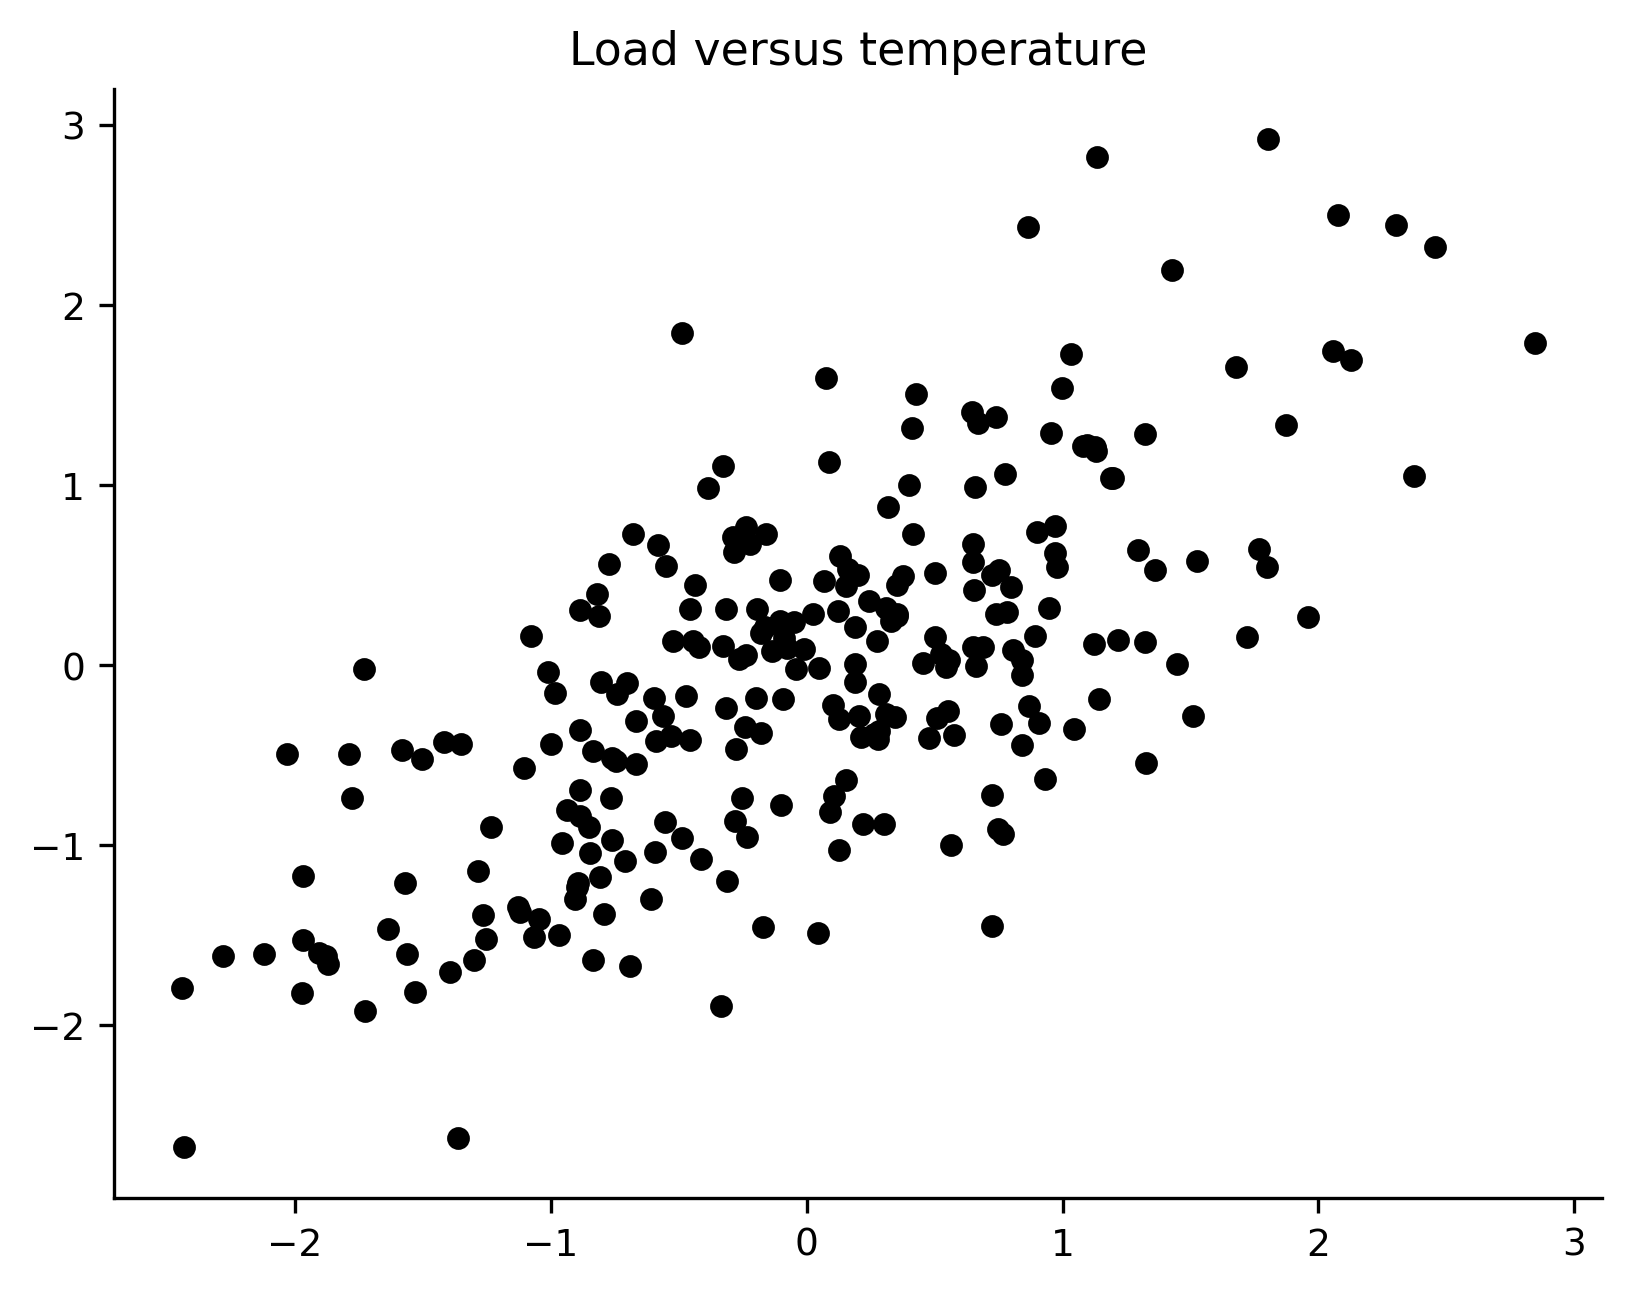
Scatter relationship
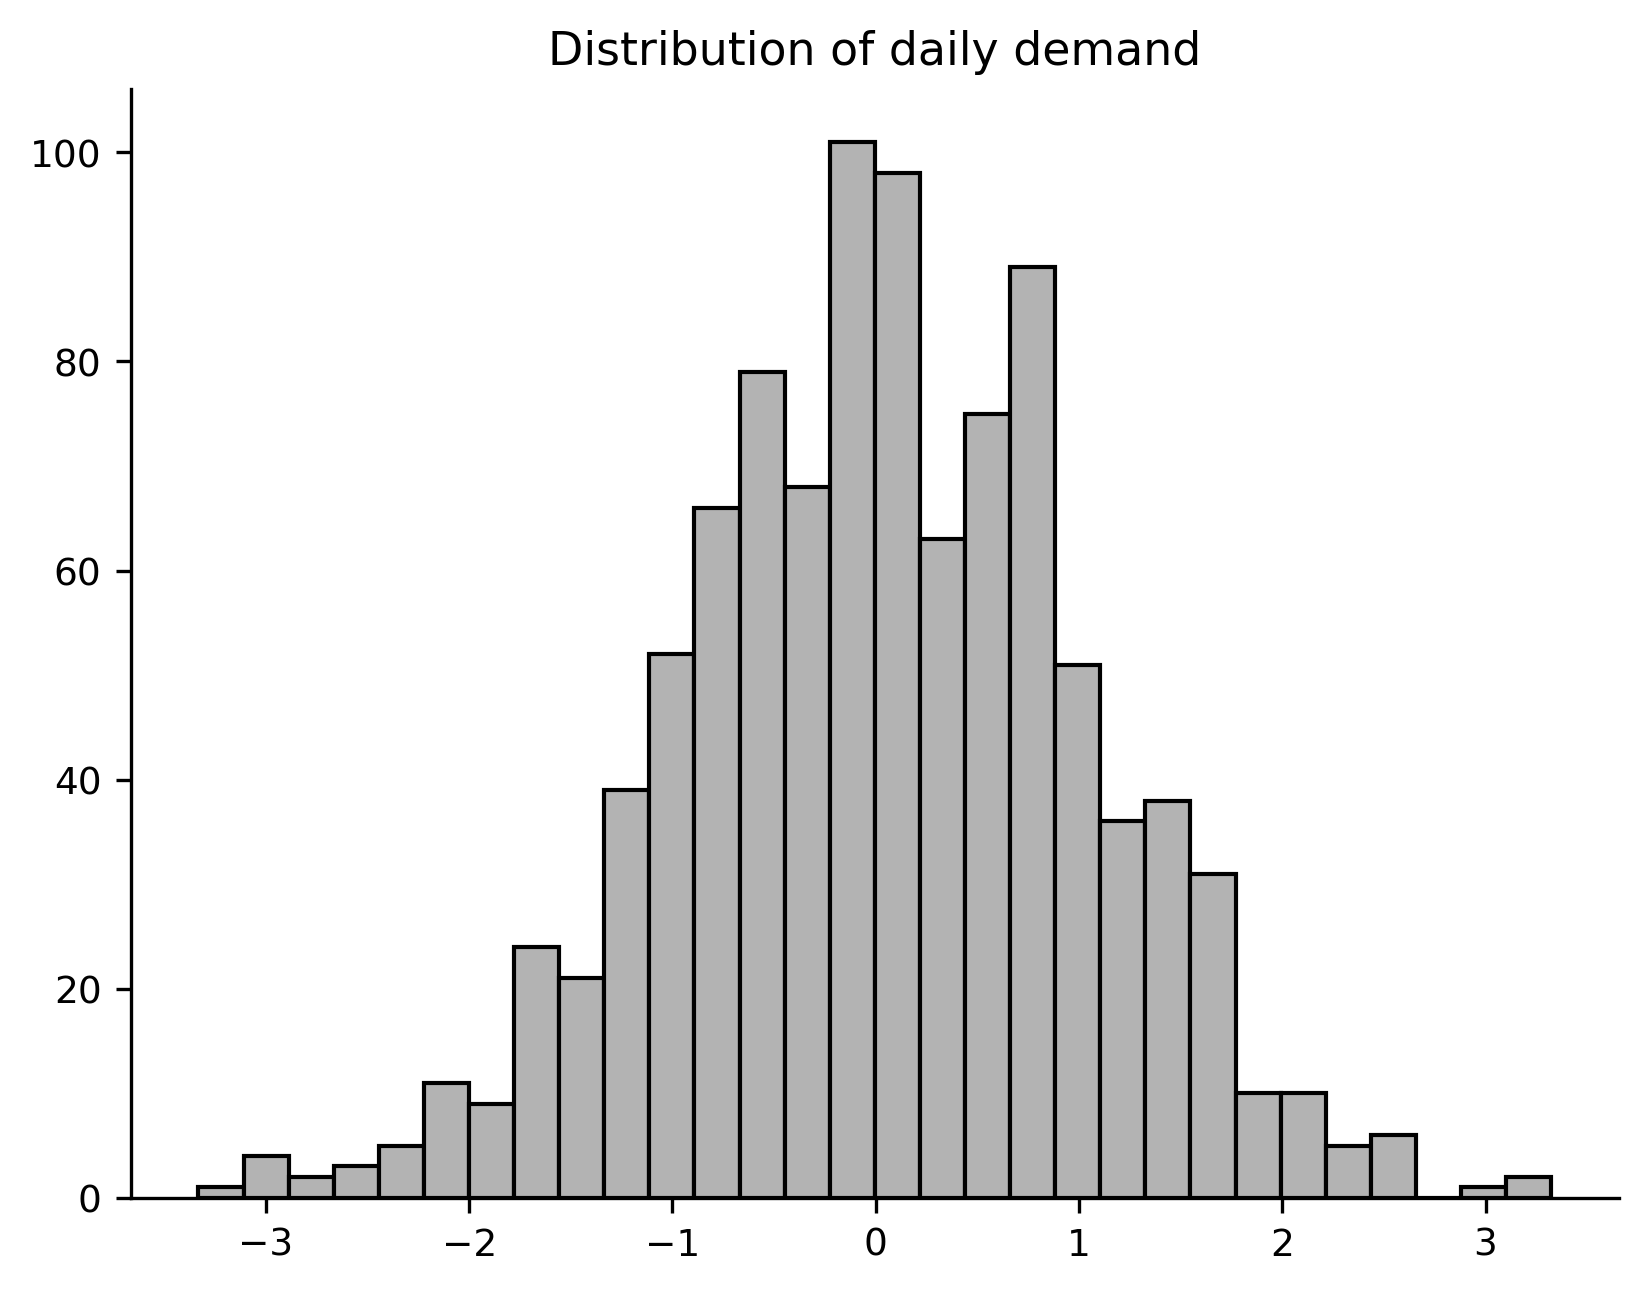
Histogram distribution
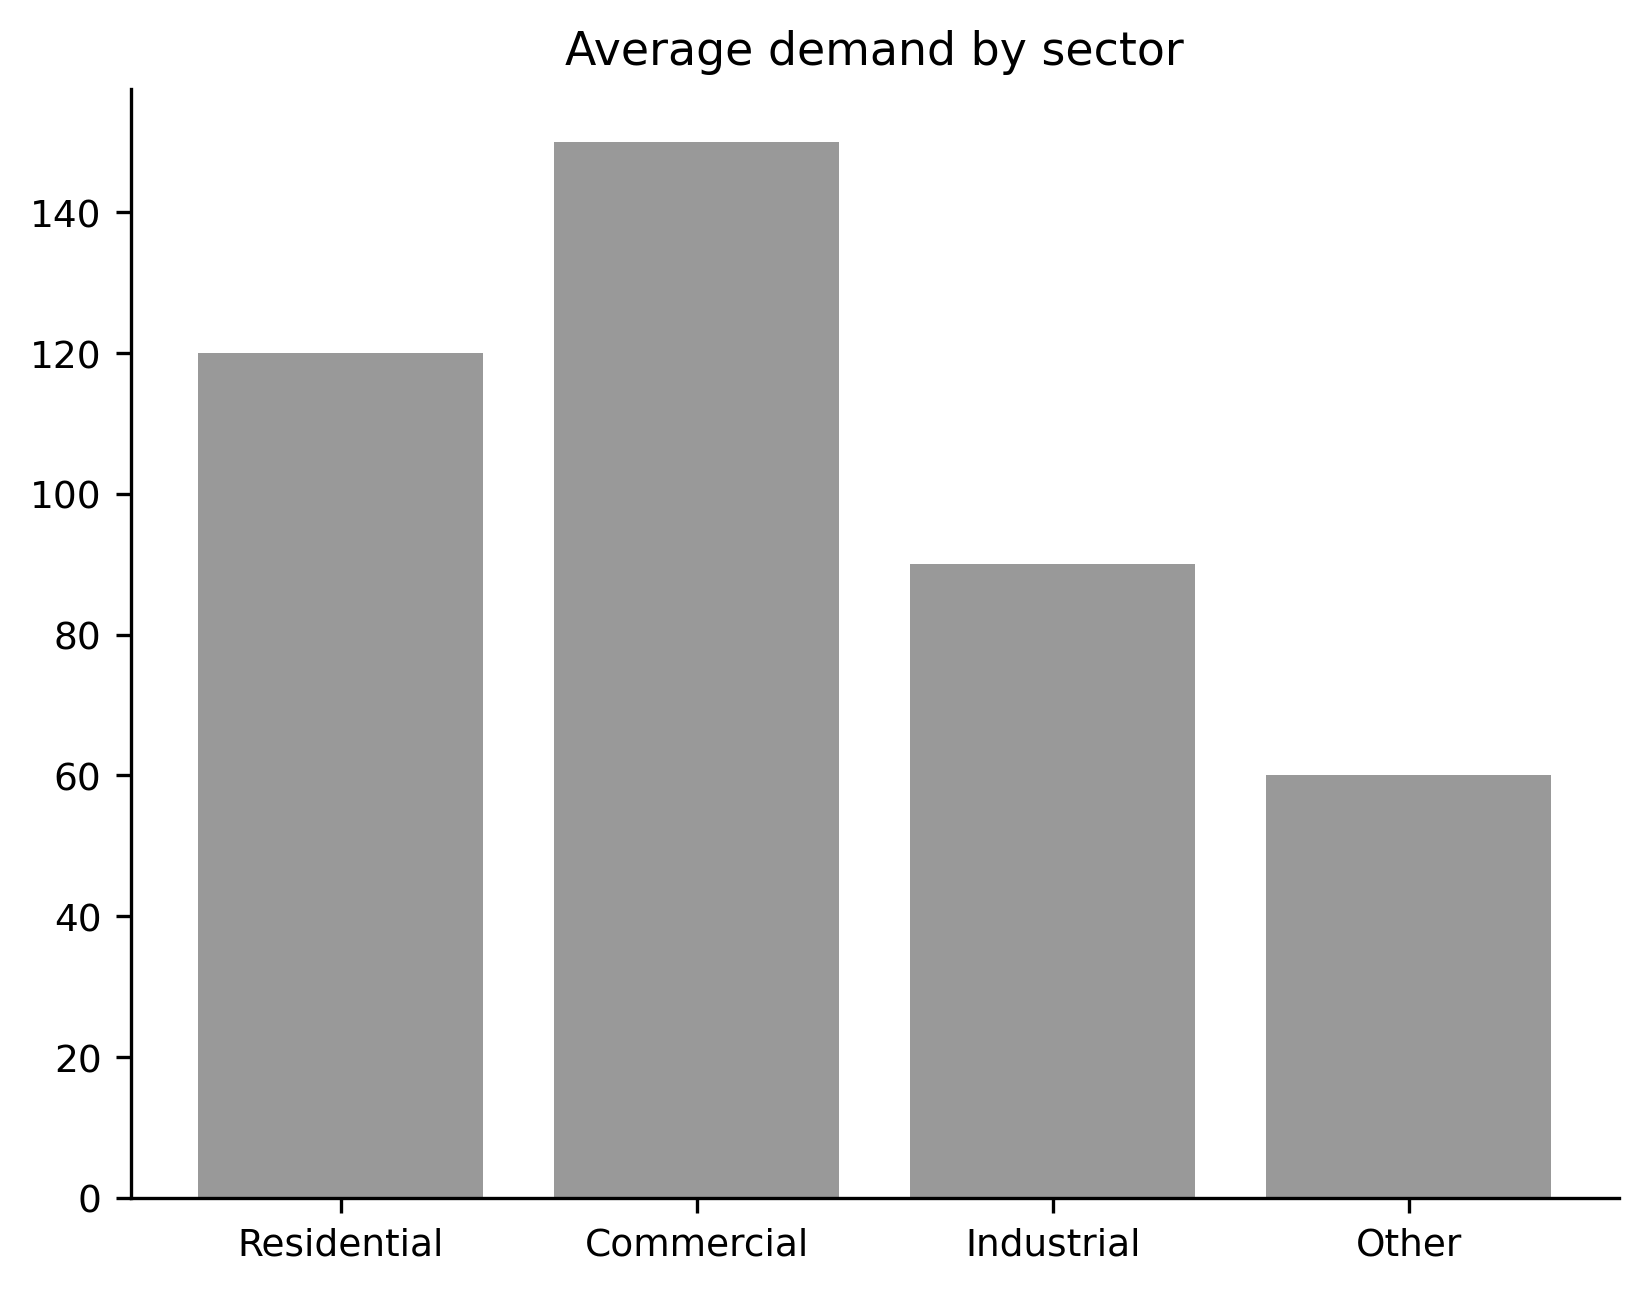
Bar chart with honest scale
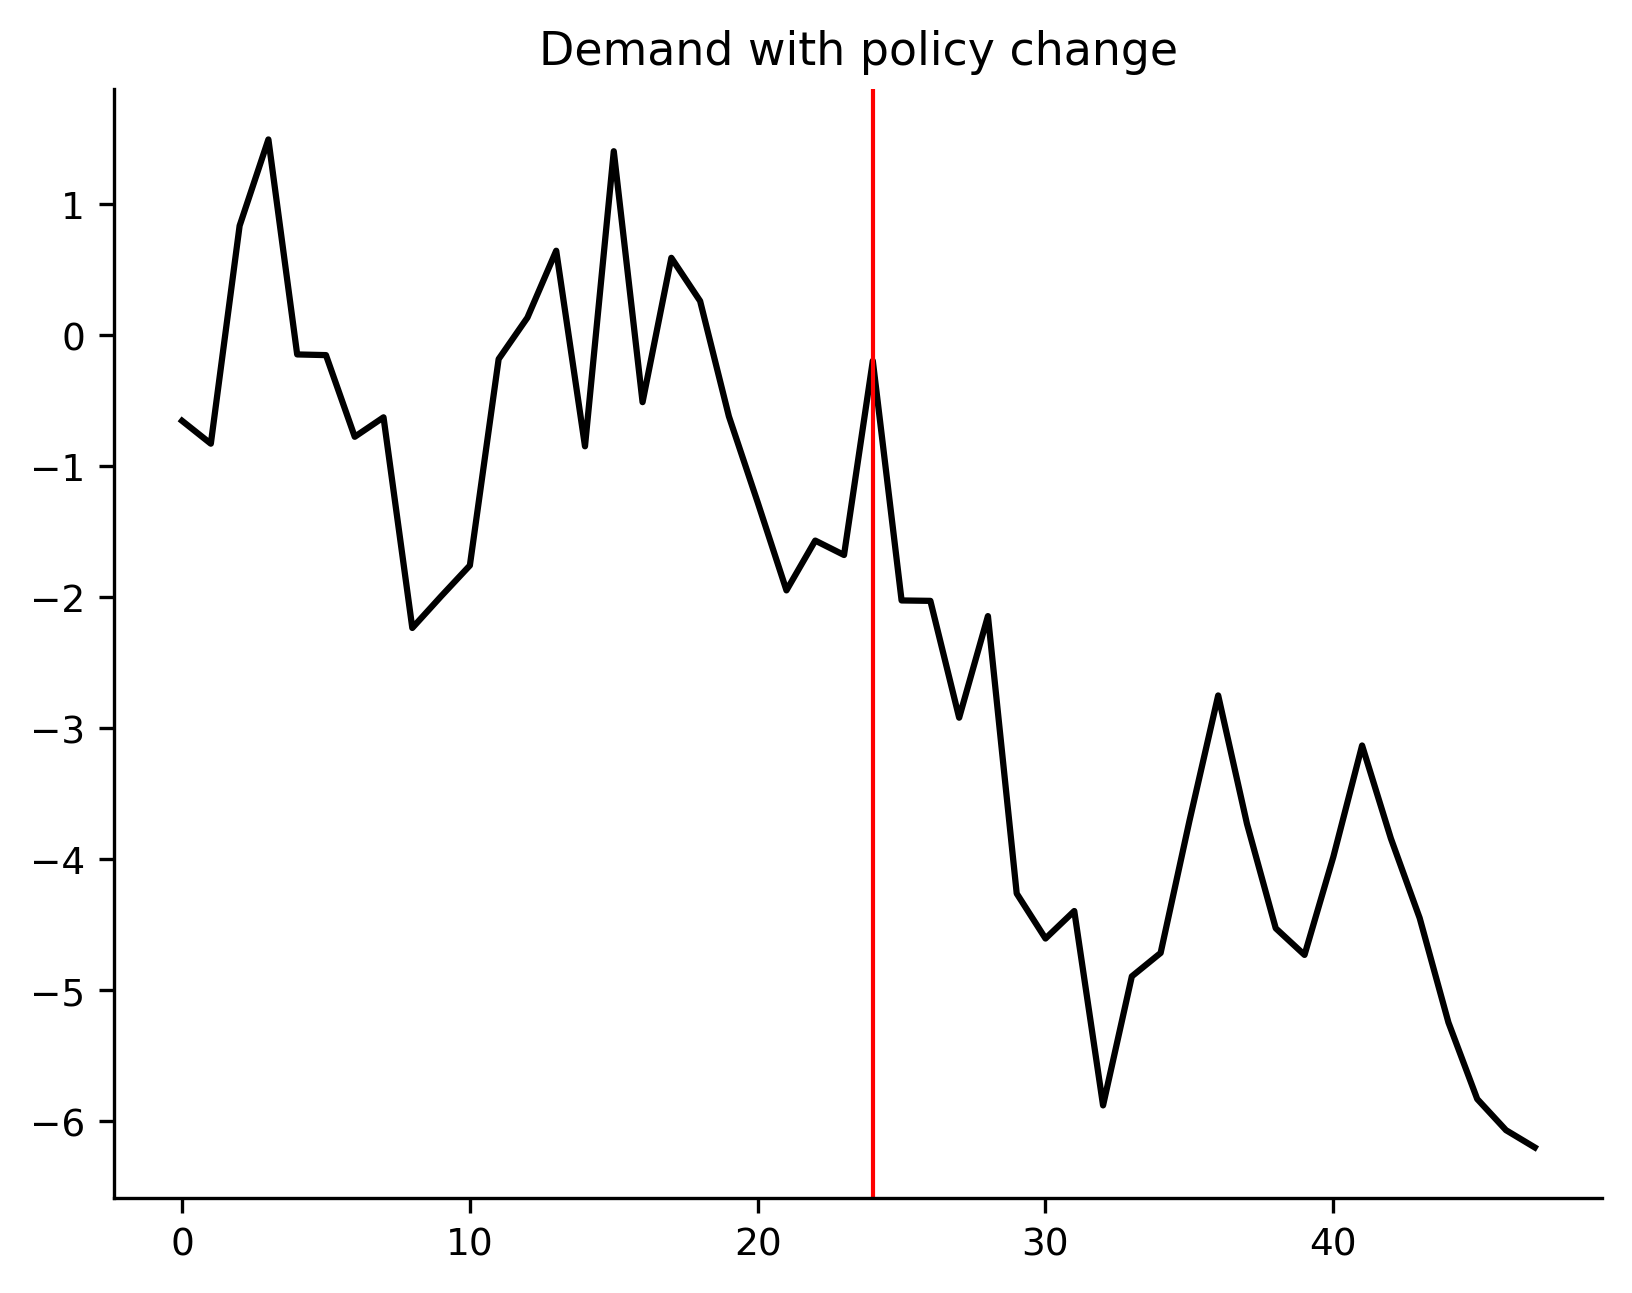
Event highlight
To regenerate these images from the repository root (requires a dev install so numpy is available for the examples):
pip install -e ".[dev]"
python scripts/regen_gallery.py
Each script writes into docs/_static/gallery/ with the filenames above.